Our models and indicators point toward a better year for investors in 2023, with a caveat. Some volatility will continue as the downward path of inflation is unlikely to follow a straight line – nothing in economics or markets ever does.
Sure enough, we had some hotter inflation data in January that caused the market to pull back 6.5% from its February peak to its early-March low.
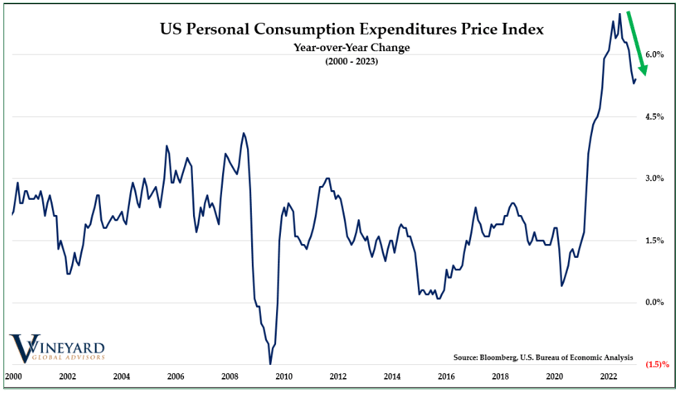
In January, the Fed’s preferred measure of inflation came in higher than expected. The Personal Consumption Expenditure Price Index (PCE) rose 5.4% year-over-year vs. the expected 5.0% increase, while the core PCE rose 4.7% vs. the 4.3% expected.
These hotter inflation numbers indicate that the Fed will likely continue to hike interest rates, probably another 100 basis points, to 5.50-5.75% by the summer of 2023 to cool down the economy and give supply a chance to catch up with the demand. Positively, the US consumer remains healthy, with Personal Consumption rising 1.8% month-over-month in January.
US consumer health argues against a severe recession this year. If we see a recession, as some economists predict in the second and third quarters of this year, it will likely be mild or a “soft landing” vs. a deep and prolonged contraction like the 2008-09 Global Financial Crisis.
As supply chains re-open from Covid shutdowns, the positive impact on prices won’t be a straight line but rather a back-and-forth affair, with some months showing more improvement than others. For example, the Bloomberg Commodity Index has fallen 25% since the spring of last year and is down a further 7% in 2023. In addition, some key commodities like natural gas have plunged from their 2022 peaks (down 80% since peaking last August).
It will take time for these price declines to flow through to lower consumer prices. Overall, we believe inflation remains on its downward trajectory and that the Fed’s job is about 80% done. The good news for investors is that the 2022 bear market discounted a lot of bad news, and we expect a better year for investors in 2023.
The general inflation trend has remained downward since peaking last June (see chart below).

We anticipated continued volatility in 2023 and the 6.5% early-February to early-March decline in the S&P 500 is consistent with years in the past that have followed bear markets. For example, coming off the bear market low of March 2009 after the Global Financial Crisis, there were 6 pullbacks of 5-10% on the way to a +26% year.
The key for the Bull case in 2023 will be if we continue to see: 1) minimal deterioration in our indicators and macro models on pullbacks, and 2) a continued pattern of higher highs and higher lows on the major equity indices since bottoming last October.
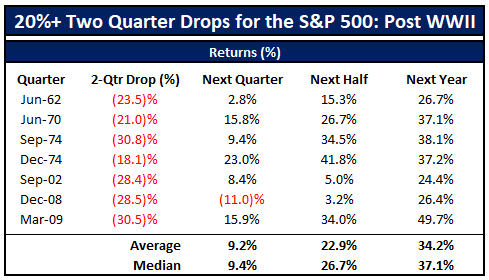
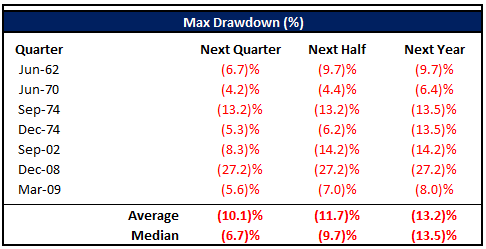
The analogs below also highlight the likelihood for some bumps along the way to a better year in 2023. Notice after 20% drops over 2 quarters in the past, like we saw last year, the S&P 500 has been up 34% the following year since WW-II, but you have to be able to stomach a 13% average intra-year decline as evidenced by the second chart below.


Source: Bespoke
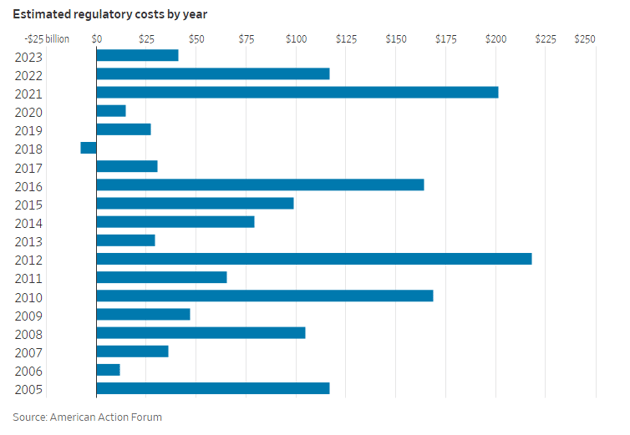
Of course, that doesn’t mean there aren’t risks to the Bull case outlook, which we continue to monitor. One such risk is the increase in regulatory costs of the Biden Administration over the past two years. A recent WSJ article pointed out the 2-year total of $318 billion in new regulatory costs from 517 regulations passed since January 2021 *(see chart below).
In addition, another $191 billion of regulatory costs are in the pipeline, although a divided Congress may short-circuit some of these. Many of these new regulatory costs will be passed on to consumers, but corporations will absorb some too. For perspective, total US corporate earnings are $2.7 trillion, so these new regulatory costs represent 12% of total corporate earnings. As a result, they may contribute to downward earnings revisions in the months and quarters ahead.

As is often said, “earnings are the mother’s milk of stock price performance.” We will be watching earnings closely in the months ahead to see if regulatory costs, inflationary pressures, or slowing economic activity start to cause significant downward revisions. If confirmed by our macro models, we will adjust accordingly.
For now, it’s a new bull market until proven otherwise. Positively, we saw very little technical deterioration in our longer-term indicators and macro models during the February pullback. That said, we want to see the pattern of higher lows and higher highs on major equity indices since bottoming last October remain intact.
-VGA Investment Team
Vineyard Global Advisors offers a range of investment strategies designed to allow participation in the market's growth within a dynamic, risk-managed framework that seeks to protect against significant market declines. Our goal is to give our clients greater peace of mind by generating steadier returns over time. Contact us to learn more.
Investment advisory services are provided through Integrated Advisors Network, LLC (“Integrated”) a registered investment advisor. Registration does not imply a certain level of skill or training. Vineyard Global Advisors, LLC is a practice group of Integrated.
The opinions expressed herein are those of Vineyard Global Advisors and are subject to change without notice. This material is not financial advice or an offer to sell any product. Forward-looking statements cannot be guaranteed. This document may contain certain information that constitutes “forward-looking statements” which can be identified by the use of forward-looking terminology such as “may,” “expect,” “will,” “hope,” “forecast,” “intend,” “target,” “believe,” and/or comparable terminology. No assurance, representation, or warranty is made by any person that any of Vineyard’s assumptions, expectations, objectives, and/or goals will be achieved. Nothing contained in this document may be relied upon as a guarantee, promise, assurance, or representation as to the future. Vineyard Global Advisors is an investment adviser registered with the U.S. Securities and Exchange Commission. Registration does not imply a certain level of skill or training. Investment advisory services offered through Integrated Advisors Network, LLC (“Integrated), a registered investment advisor. Vineyard Global Advisors is a DBA of Integrated.
The S&P 500 Index is a stock market index that tracks the performance of 500 of the largest publicly traded companies in the United States. It is market-capitalization-weighted, meaning companies with a larger market value have a greater impact on the index. The S&P 500 is widely used as a benchmark for the U.S. equity market and provides a broad representation of various sectors of the economy, including technology, healthcare, financials, and consumer goods. It is often used by investors to gauge overall market performance and to compare the returns of individual investment portfolios. This document contains performance data that references the S&P 500 Index (the "Index"). The S&P 500 Index is a market capitalization-weighted index of 500 of the largest publicly traded companies in the U.S., and is widely regarded as a benchmark for the U.S. equity market. Please note that the S&P 500 Index is unmanaged and does not include transaction costs, fees, or expenses associated with the purchase or sale of securities. Unlike the performance of the Fund, which may be subject to fees, the performance of the Index does not reflect the impact of these costs. Index returns are typically gross returns, unless otherwise specified. Past performance of the Fund or its manager is not indicative of future results, and there can be no assurance that the Fund will outperform or track the performance of the S&P 500 Index or any other benchmark. The S&P 500 Index is used solely for comparison purposes and does not reflect any investment strategy or portfolio. It is not possible to directly invest in the S&P 500 Index.
There is no guarantee that the investment objectives will be achieved. Moreover, past performance is not a guarantee or indicator of future results. Does not constitute advice or a recommendation or offer to sell or a solicitation to deal in any security or financial product. It is provided for information purposes only and on the understanding that the recipient has sufficient knowledge and experience to be able to understand and make their own evaluation of the proposals and services described herein, any risks associated therewith and any related legal, tax, accounting or other material considerations.
Integrated is registered with the Securities and Exchange Commission (SEC). Registration of an investment adviser does not imply any specific level of skill or training and does not constitute an endorsement of the firm by the Commission. Business is only transacted in states in which it is property registered or is excluded or exempted from registration. A copy of Integrated's and VGA's current written disclosure brochure filed with the SEC which discusses among other things, business practices, services and fees, is available through the SEC's website at: www.adviserinfo.sec.gov
These Perspectives on Market Updates
Vineyard Global Advisors, LLC (“the Adviser”, “Vineyard Global Advisors”, or “VGA”) is a DBA of Integrated Advisors Network, LLC (“Integrated”). Integrated is an SEC registered investment advisor. Registration does not imply a certain level of skill or training. VGA is affiliated with, but not under common control of, Integrated.
More information about Vineyard Global Advisor, including our investment strategies, fees and objectives, can be found in our Form ADV Part 2A and our Form CRS.
Copyright © 2026 | Vineyard Global Advisors LLC | All Rights Reserved.
Lorem ipsum dolor sit amet, consectetur adipiscing elit. Cras eu mauris dapibus ante interdum tempor non eu metus. Vestibulum ante ipsum primis in faucibus orci luctus et ultrices posuere cubilia curae; Sed lobortis sodales consequat.