The market remains concerned about stretched valuations and a repeat of the dot-com bust of 2000-03 when the S&P 500 lost over 50% of its value. However, major indices have just recently recouped their considerable bear market declines of 2022, and historically, the stock market has shown a strong tendency to continue to rally after a bear market decline is fully recouped vs. rolling back into another bear market decline of 20%+.
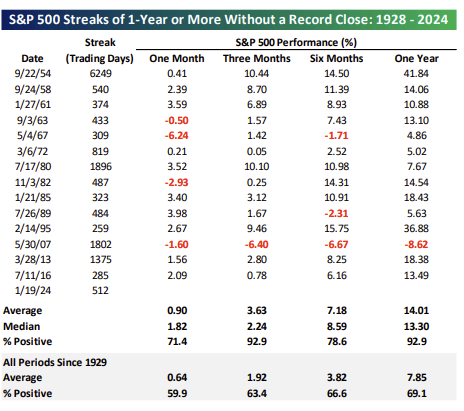
As shown below, since WWII, the S&P 500 has gone on to post an average 14.0% gain after a 1-year or more streak without a record close has ended (as it did on 1/19/24 when the 18% decline in the S&P 500 was finally recouped). As shown by the far right column, the S&P 500 posted positive returns in 13 out of 14 instances (93%) one year later. The only instance where it didn’t was during the Global Financial Crisis of 2007-2009, the equivalent of a 100-year storm.
 Source: Bespoke
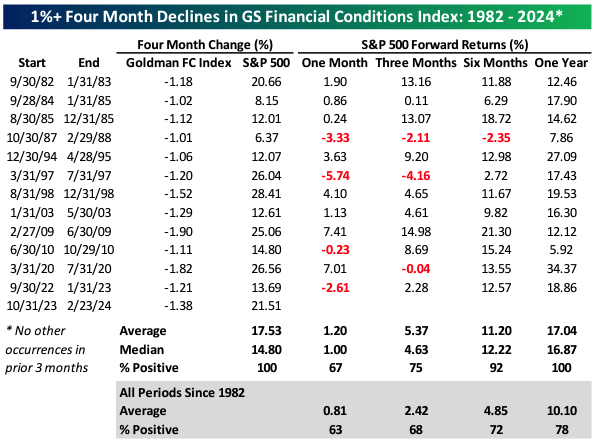
Looking closer at the one instance where the S&P 500 was lower one year later (during the GFC), the rapid deterioration in financial conditions as subprime mortgage loans failed during that episode was flagged by numerous risk metrics, which is not the case currently. For example, Goldman Sach’s Financial Conditions Index (GSFCI) - a daily update on US financial conditions - is not flagging crisis level financial stress currently. Quite the opposite. It has recently shown a high level of improvement (or loosening) in financial conditions over the past four months. As shown in the table below, the GSFCI has only fallen (lower = improving or loosening) 1% or more thirteen times since 1982, and in every single instance, the S&P 500 has been higher 6 and 12 months later, by an average of 11.2% and 17.0%, respectively. Both averages are considerably better than the average of all 6 and 12-month periods since 1982 of 4.9% and 10.1%, respectively.
 Source: Bespoke
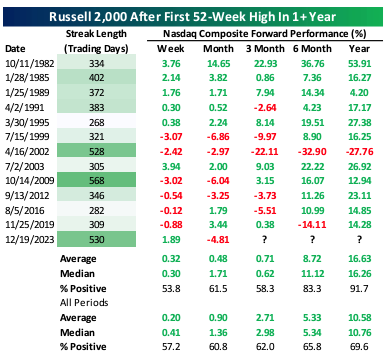
Looking at other major stock market indices, like the US small-cap Russell 2000 index, a similar strong tendency towards further gains is seen. As shown below, the Russell 2000 index, has gone on to post a 16.6% gain one year after failing to hit a new high in the past year in 11/12 instances.
 Source: Bespoke
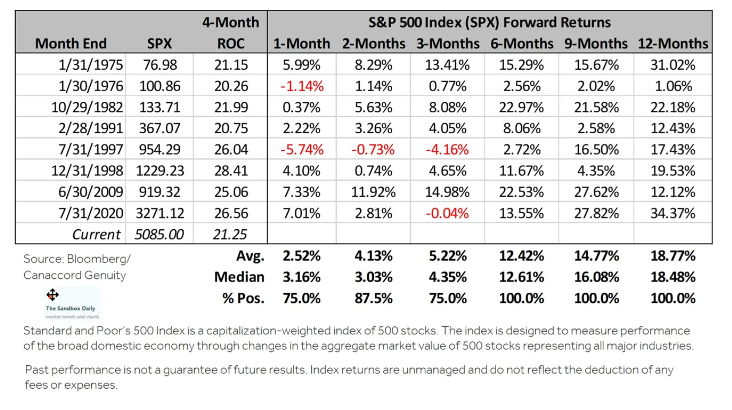
Finally, not only has there been a strong tendency towards further gains after a bear market decline is recouped, but other analogs looking at the consistency and strength of four-month gains also suggest the market is on solid technical footing. As shown below, once the 4-month rate of change of the S&P 500 exceeds +20% (as it just has), forward returns have been positive in every single instance since 1975 over the next 6, 9, and 12 months. The S&P 500 has gone on to gain 12.4%, 14.8%, and 18.8% on average over the next 6, 9, and 12 months, respectively.
 Sources: Bloomberg, Canaccord Genuity, Grindstone